Research Highlights – 2006 to 2016
The largest river basin in the U.S.A. Encompasses 1.28 million km2 area in 10 States, many Native American reservations, and parts of Canadian provinces of Alberta and Saskatchewan. Produces 46% of wheat, 22% of grain corn, and 34% of cattle produced in the U.S.A. Value of crops and livestock produced in the MRB over $100 billion per year. 117 million acres of cropland, only 12 million acres irrigated. Over 2000 urban population centers of various sizes. Major dependence on water from the Missouri River and its tributaries for domestic and municipal uses, irrigation and industrial needs, hydro-electricity, recreation, inland water-borne transportation, and fish and wildlife habitat maintenance.
Precipitation, temperature, and area under severe to extreme droughts undergo multiyear to decadal variability (Figures 1 and 2).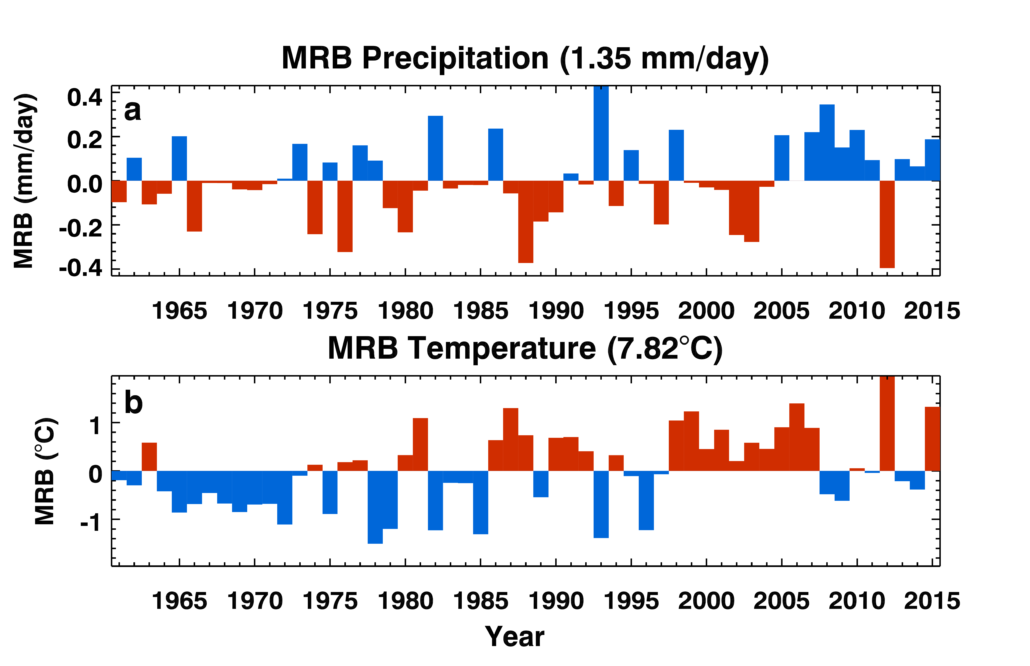 Figure 1: Precipitation and surface air temperature anomalies averaged over the Missouri River Basin from 1961 to 2010.
 Figure 2: Percent area of the Missouri River Basin under severe to extreme drought from 1895 to 2004.
Yields and productions of spring and winter wheat, soybeans, corn, alfalfa, and other crops undergo multiyear to decadal variability (Figure 3). Correlation coefficients between each of the wheat production time series and the Pacific Decadal Oscillation (PDO) index time series approximately 0.5 (at least 95% significance) without smoothing and 0.65 after smoothing time series.
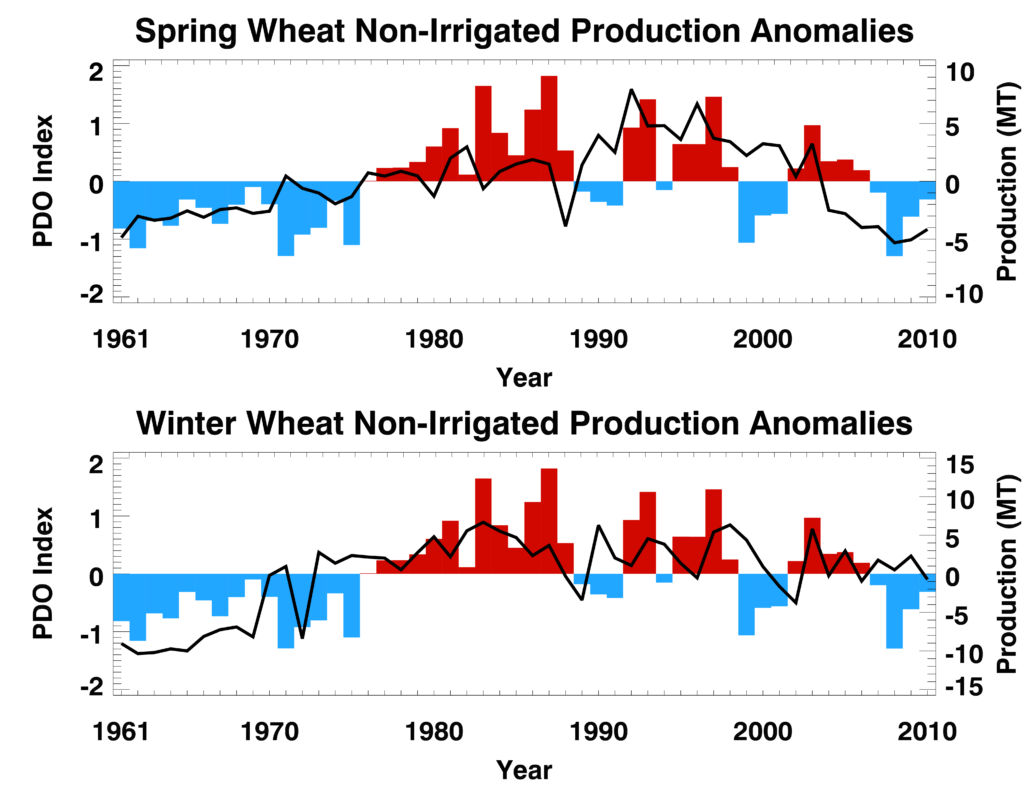 Figure 3: Spring and winter wheat production anomalies (bars; million tons; right scale) in the Missouri River Basin from 1961 to 2010. The average productions in this period were 6.63 million tons and 13.8 million tons, respectively, for spring wheat and winter wheat. The Pacific Decadal Oscillation index (black line; left scale) is also shown.
Exploratory project on hydrologic vulnerability of the MRB to interannual to decadal climate variability (DCV) showed that the PDO, the tropical Atlantic sea-surface temperature (SST) gradient variability, and the West Pacific Warm Pool (WPWP) SST variability make substantial impacts on yields of surface water and major crops such as wheat and corn in the MRB (Project I; Mehta et al., 2011, 2012). Workshops and individual meetings with over 100 farmers; water managers; government officials at local, state, and federal levels; and other stakeholders revealed that (1) impacts, including economic impacts, of DCV on water and agricultural production in the MRB are identifiable and quantifiable; (2) they have clear notions about their needs for decadal climate information and specific suggestions of how these might be met; (3) there are many potential barriers to the use of decadal climate information such as the credibility of decadal climate outlooks, the nature of institutional rules and regulations, laws, and legal precedents (Project II; Mehta et al., 2013). This exploratory research also s
howed the need for more quantitative studies of DCV impacts and the need to draw more generalizable and detailed conclusions from such studies.
In view of exciting and encouraging results of exploratory research, a Program consisting of individually-funded projects launched in 2011 (Figure 4).  Figure 4: Program framework.
Program consists of simulation and predictability studies of DCV and its impacts on surface and ground water, including urban water systems, and agriculture; use of downscaled decadal hindcasts (retrospective forecasts) and forecasts made by global Earth System Models; assessment of DCV information needs of stakeholders; estimation of the value of DCV information to MRB agriculture, and development of adaptation options for MRB agriculture to cope with DCV.
The Soil and Water Assessment Tool (SWAT), a state-of-the-art land use – hydrology – crop model – used to simulate impacts of the Pacific Decadal Oscillation (PDO), the tropical Atlantic sea-surface temperature (SST) gradient, and the West Pacific Warm Pool (WPWP) SST variability on water and agriculture. SWAT calibrated for water flows and major crops (spring and winter wheat, soybeans, corn) in 12-digit Hydrologic Unit Code watersheds (over 15,000 in total at 12 km x 12 km resolution) spanning the entire MRB; SWAT able to capture reasonably well the hydrological and crop growth dynamics despite some limitations (Daggupati et al., 2016). 29 SWAT experiments conducted to simulate impacts of the three DCV phenomena on water yield, river flow, and crop yields. SWAT, driven by hydro-meteorological anomalies associated with positive and negative phases of PDO and TAG, indicated major impacts on water yields and river flows, as much as 40% of the average in many locations; impacts of the WPWP index were smaller. Positive PDO phase and negative TAG phase superimpose to cause wet epochs and negative PDO phase and positive TAG phase superimpose to cause dry epochs (Figure 5). Consistent with observations during 1949–2010, SWAT showed water flow increases of as much as 80% of the average, causing very wet periods when positive phase of the PDO and negative phase of the TAG at extreme amplitudes superposed (Figure 6). Water flows decreased by a similar amount, resulting in severe to extreme droughts when negative phase of the PDO and positive phase of the TAG at extreme amplitudes superposed (Figure 6). 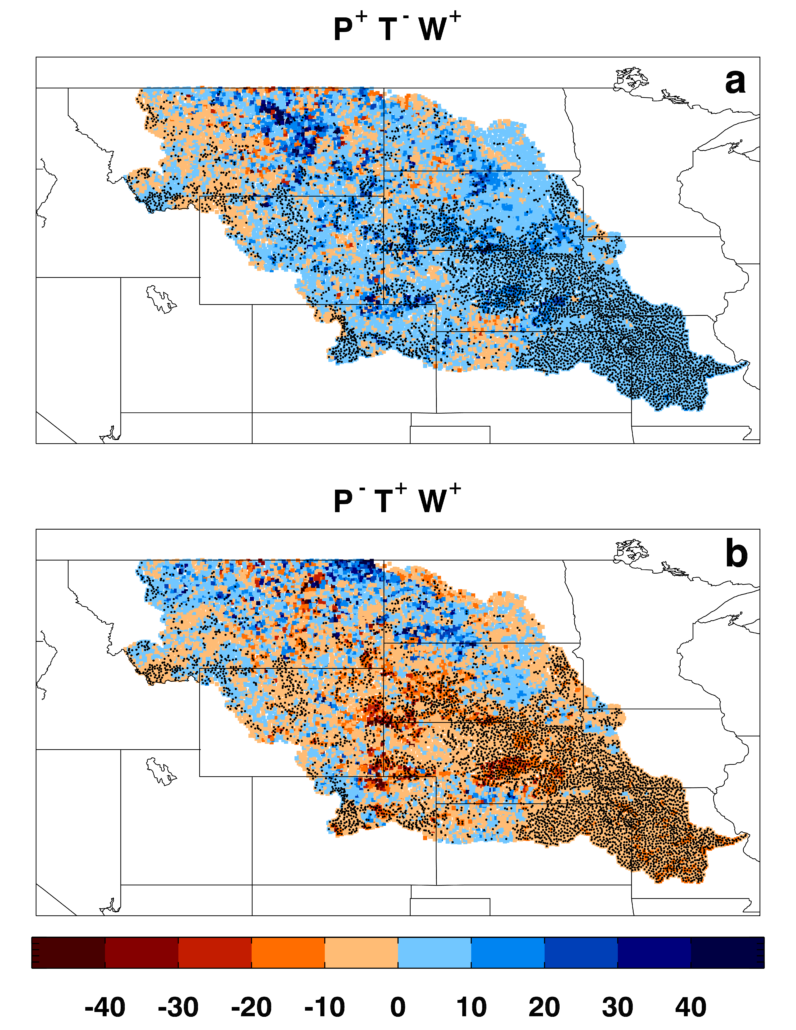 Figure 5: SWAT-simulated annual-average water yield (% change from climatology) in the MRB in (a) (PDO+, TAG-, WPWP+) and (b) (PDO-, TAG+, WPWP+) scenarios. Black dots show locations of 95% significance.
Thus, the combined and cumulative effects of these DCV phenomena on water flows, droughts, and wet periods in the MRB can be dramatic, with important consequences for all water-consuming sectors as well as for feedbacks to the climate system (Mehta et al., 2016).
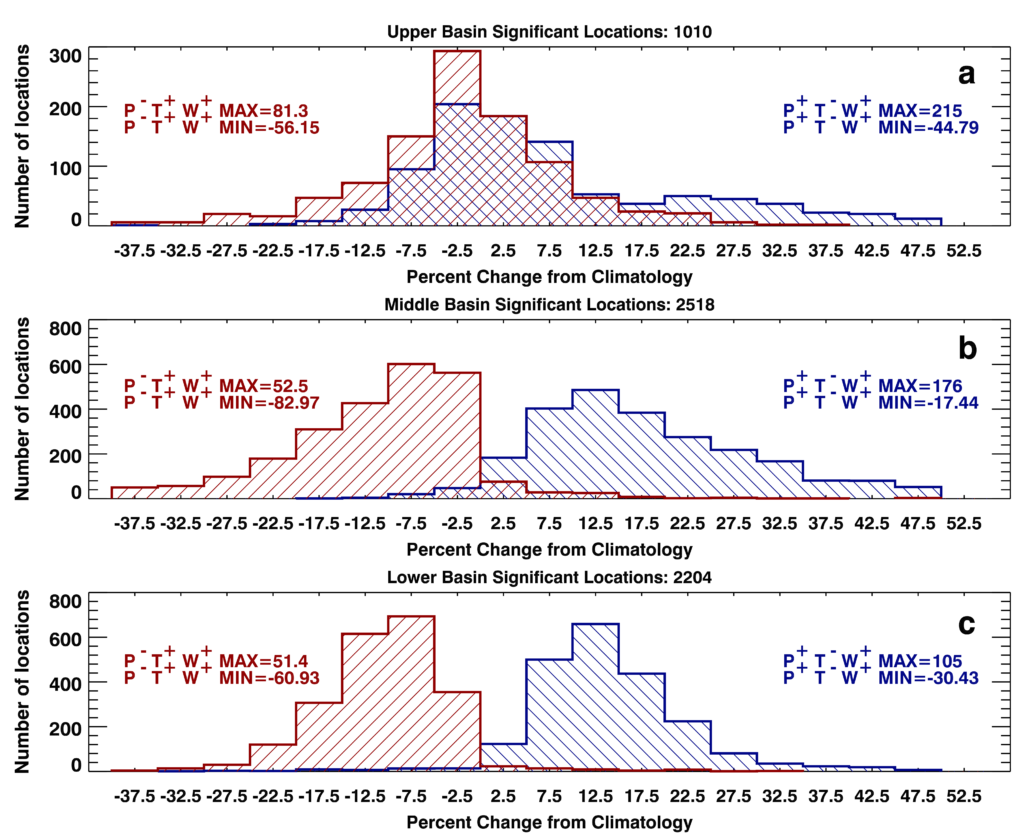 Figure 6: Histograms of aggregated water yields in three parts of the MRB for (PDO+, TAG-, WPWP+) and (PDO-, TAG+, WPWP+) scenarios at extreme amplitudes: (a) upper, (b) middle, and (c) lower.
Simulated annual-average daily streamflow in one wet (1982–86) and one dry (1987–90) period to further compare impacts of idealized DCV scenarios and observed river flows. The PDO index in positive phase during the wet period and negative phase during much of the dry period; the TAG index in negative phase during the wet period, but fluctuated between positive and negative phases during the dry period. Annual-average daily river flow anomalies at specific locations observed by the USGS gauge network and simulated by SWAT at the same locations generally similar for the 1982–86 wet period (Figure 7) and the 1987–90 dry period (Figure 8); differences between the observed and simulated streamflow anomalies reasonably small. Simulated impacts of DCV phenomena consistent with observed association between DCV phenomena and river flow anomalies; perfect agreement not expected as topography, soil type, antecedent soil moisture conditions, and vegetative cover also control surface and groundwater flows, and all of the latter factors treated as uniform over the entire area of each 12-digit sub-basin (Mehta et al., 2016).
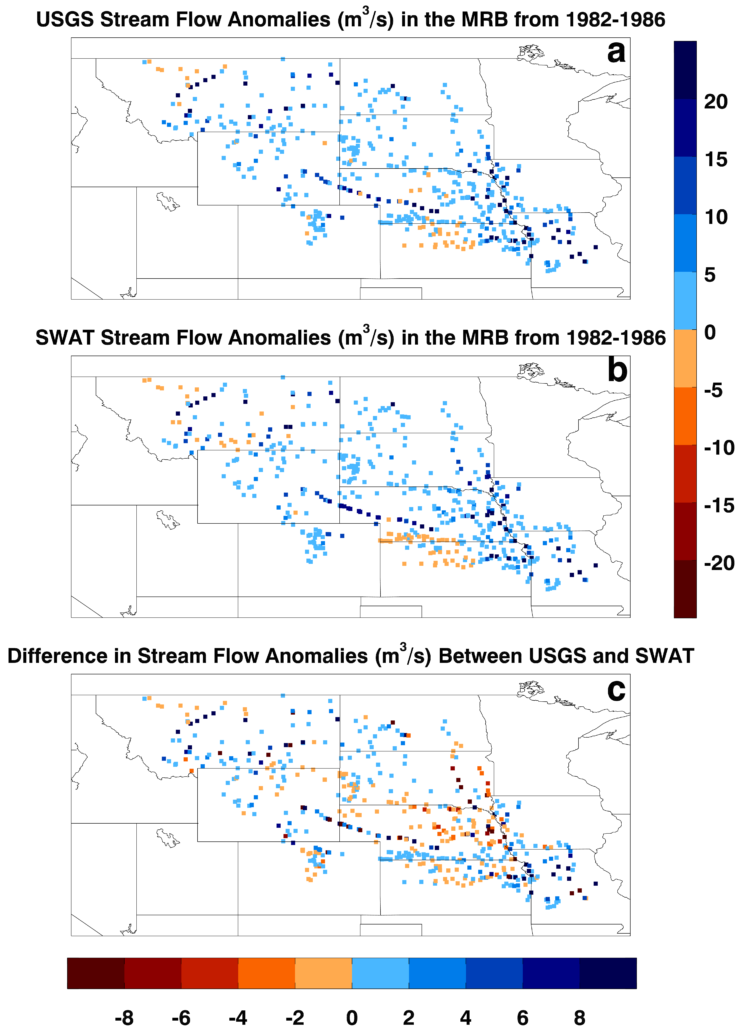 Figure 7: Annual-average river flow (m3s-1) in the MRB from 1982 to 1986: (a) observed USGS estimate, (b) simulated SWAT estimate, and (c) difference between (a) and (b).
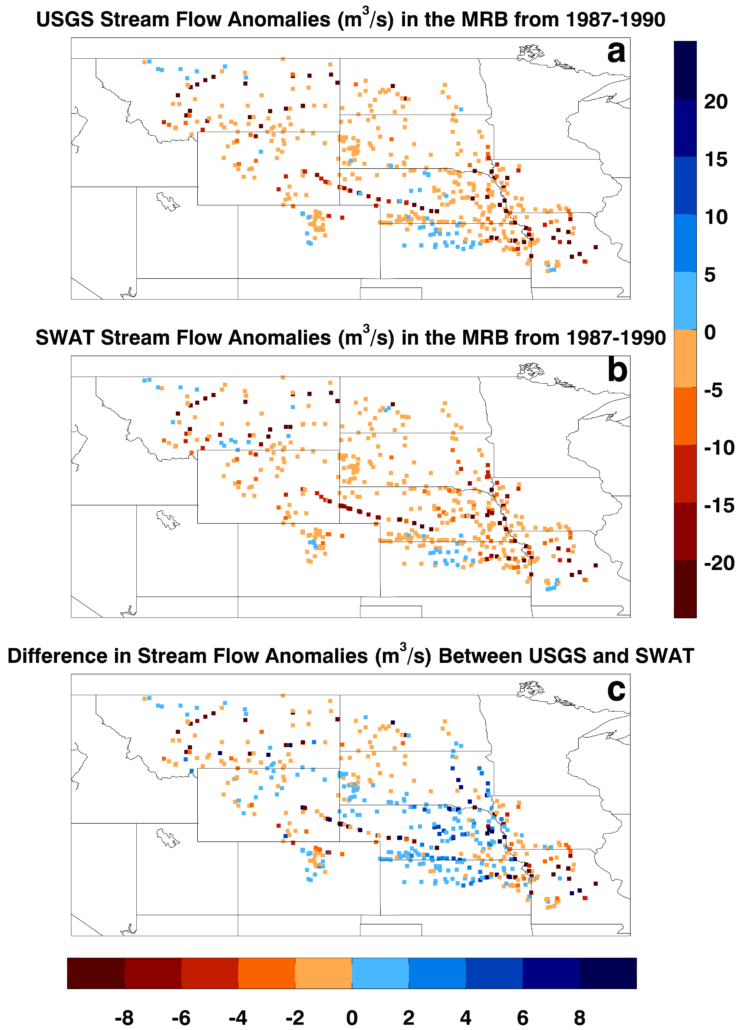 Figure 8: Annual-average river flow (m3s-1) in the MRB from 1987 to 1990: (a) observed USGS estimate, (b) simulated SWAT estimate, and (c) difference between (a) and (b).
SWAT, driven by hydro-meteorological anomalies associated with positive and negative phases of the PDO and TAG, indicated major impacts on wheat yields, as much as ±40% of the average in many locations; smaller impacts of the WPWP index variability. Wheat yield increases of as much as 40% causing abundant production when positive phase of the PDO and negative phase of the TAG superposed (Figure 9a); wheat yields decreased by a similar amount when negative phase of the PDO and positive phase of the TAG superposed (Figure 9b). Thus, combined and cumulative effects of DCV phenomena on winter and spring wheat yields and production dramatic with important consequences for regional and global food securities (Mehta et al., 2017). There are substantial impacts on soybeans, corn, alfalfa, and other crops also.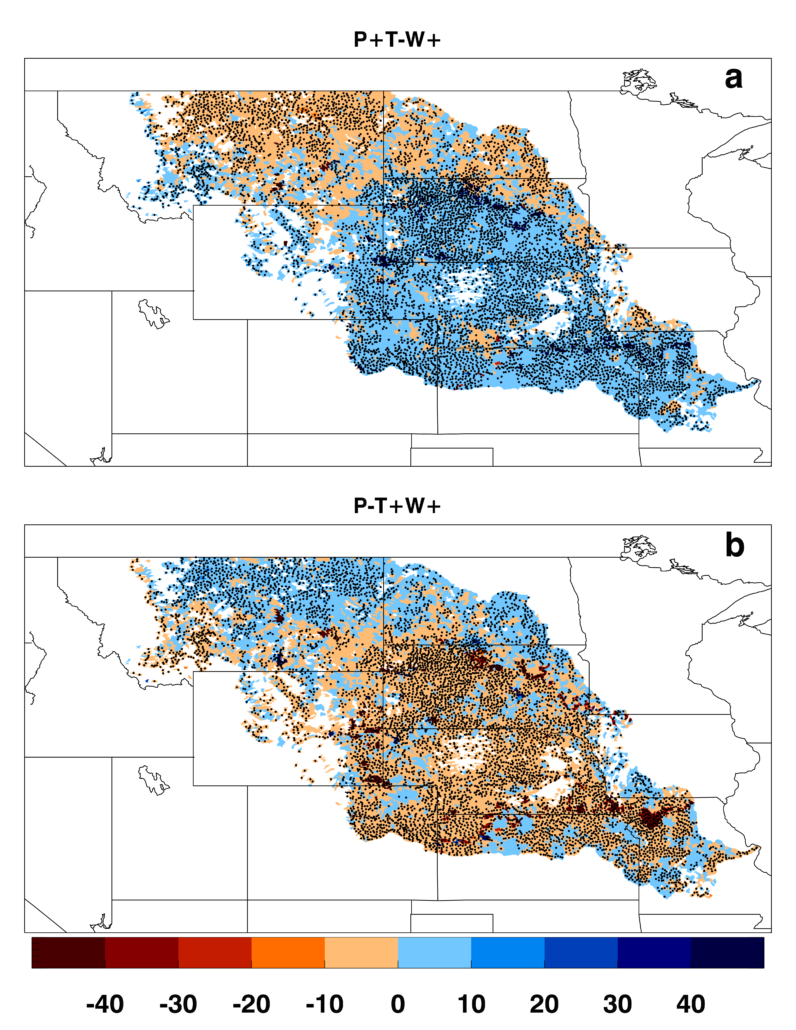 Figure 9: SWAT-simulated annual-average winter wheat yield (% change from average yield) in (a) (PDO+, TAG–, WPWP+) and (b) (PDO–, TAG+, WPWP+) scenarios. Black dots show locations of 95% significance.
Exploratory study of impacts of interannual to decadal climate variability on urban water security in three case-study areas, and mail survey of over 700 urban water systems of various sizes. Substantial impacts of interannual to decadal climate variability on urban water security in three case-study areas: small (Great Falls, Montana), medium (Lincoln, Nebraska), and large (Kansas City, Kansas and Missouri). Impacts on supply, demand, and access; degree of impacts dependent on location with respect to water source, size of supply need, and effectiveness of conservation measures. Municipal water demand clearly affected by precipitation and temperature. PDO impacts even electricity cost for pumping water and chemical cost for treating water in Great Falls, Montana, where such data available. Reasonable success in predicting probabilities of future climate impacts on water several seasons in advance, based on past data on phases of DCV, and impacts on local precipitation and temperature in the case-study areas. SWAT forced with observed hydro-meteorological anomalies shows substantial sensitivity of water yields to DCV; good agreement between observed water consumption and other associated variables in Great Falls and Lincoln, and SWAT-simulated water variables. During drought, significant increases in water demand and voluntary or mandatory water restrictions have to be applied; during wet periods, significant decreases in water demand and increases in water rates charged to customers. 33-50% water systems use longer term climate outlooks for planning future water storage needs, expanded distribution systems, justifying infrastructure investments, bringing on new water supplies, adjusting reservoir levels, scheduling personnel, making budget projections, implementing water restrictions, and initiating public information campaigns for water conservation. Over 40% of the respondents likely to use 1- to 2- year climate outlooks for making budget projections, justifying infrastructure investments, implementing water restrictions, and informing the public on water conservation; 20-25% likely to use 1- to 2- year climate outlooks for adjusting reservoir levels or planning expanded distribution systems. The most beneficial information for decision-making seasonal and 1- to 2- year outlooks of above- or below- normal precipitation and temperature. Water system managers are interested in using climate information in their decision-making process if such information is available.
Assessment of the ability of CM2.1, HadCM3, MIROC5, and CCSM4 Earth System Models (ESMs) to hindcast SST indices of three DCV phenomena – the PDO, the TAG variability, and the WPWP SST variability – from 1961 to 2010 (Mehta et al., 2017a). Data from decadal hindcast experiments conducted under CMIP5 used. All ESMs hindcast occurrence frequencies of positive and negative phases of the DCV indices, and probabilities of same-phase transitions from one year to the next reasonably well (Figure 10). 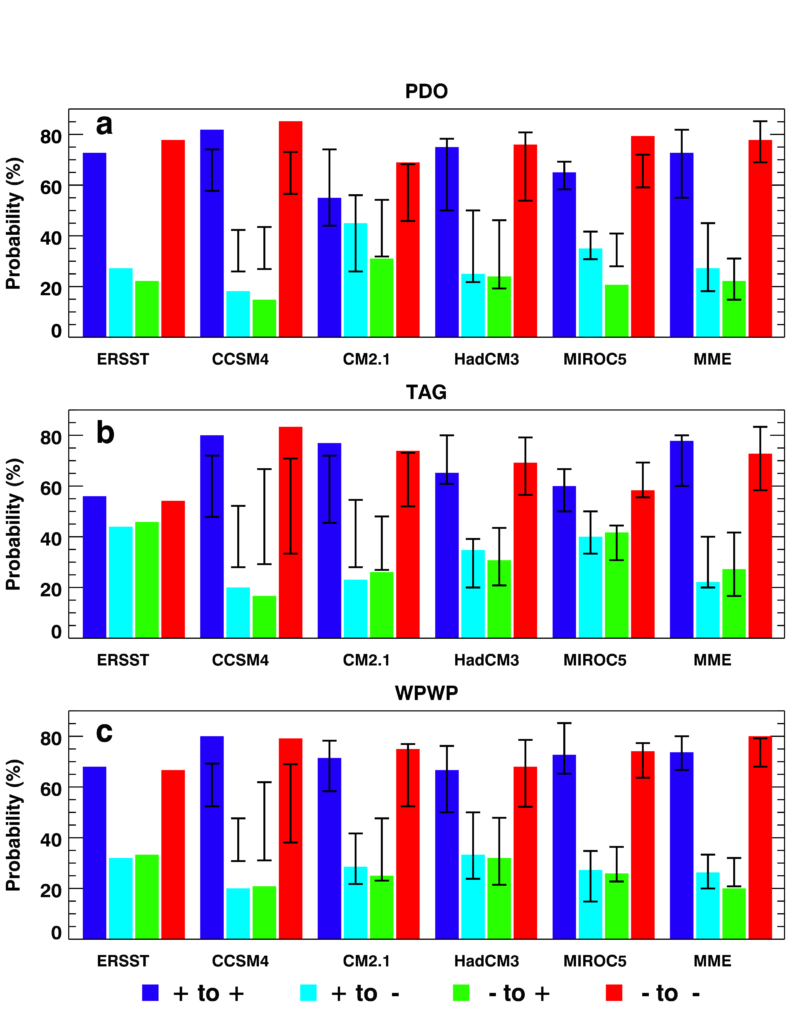 Figure 10: Probabilities of transitions among phases of (a) the Pacific Decadal Oscillation,(b) the tropical Atlantic SST gradient variability, and (c) the West Pacific Warm Pool SST variability from 1961 to 2010 in ERSST data, and in decadal hindcasts made with CCSM4, CM2.1, HadCM3, and MIROC5 Earth System Models. For the model data, color bars show probabilities derived from ensemble-average data and black whiskers show the range of probability derived from ensemble members.
Decade-average PDO hindcasts show significant skill after the 1970s and WPWP hindcasts show significant skill in all decades except the 1980s (Figure 11). Volcanic eruptions in 1963, 1974-75, 1981-82, and 1991-92 associated with phase transitions of indices in observed data and in some of the ensemble-average hindcasts. Some of the phase transitions associated with volcanic eruptions also present in non-initialized simulations with these ESMs. Hindcasts from some of the ESMs show correct phase transitions in the absence of AOD changes also, implying that initializations of the ESM hindcasts with observed data beneficial in predicting phase transitions of DCV indices.
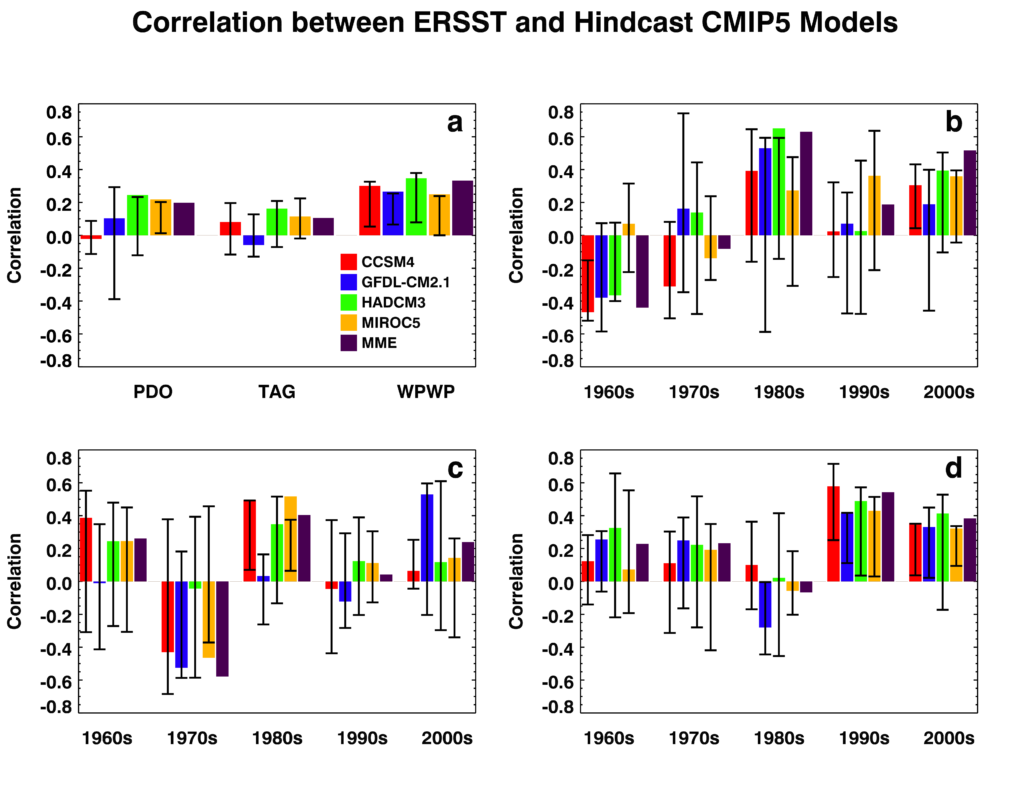 Figure 11: Correlation coefficients between ERSST and hindcast indices of the PDO, the TAG variability, and the WPWP SST variability from 1961 to 2010 in decadal hindcasts made with CCSM4, CM2.1, HadCM3, and MIROC5 Earth System Models, and the Multi-Model Ensemble (MME). Color bars show correlation coefficients derived from ensemble-average data and vertical lines show the range of coefficients derived from ensemble members. (a) 1960 to 2010, (b) PDO, (c) TAG, and (d) WPWP.
There may be usable skill of PDO and WPWP indices’ phase prediction up to at least two years in advance and also of decade-average indices which are now being used to make impacts predictability and prediction studies (Figure 12).
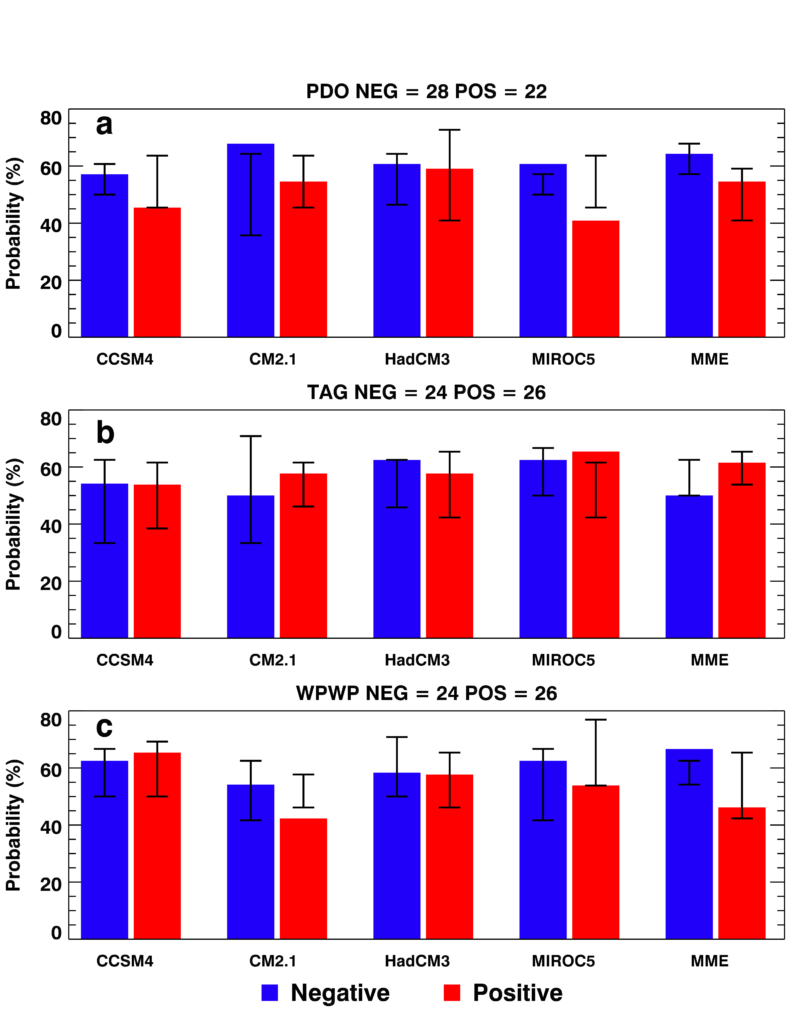 Figure 12: Probabilities of correct prediction of phases of the PDO, the TAG variability, and the WPWP SST variability from 1961 to 2010 in ERSST data, and in decadal hindcasts made with CCSM4, CM2.1, HadCM3, and MIROC5 Earth System Models. (a) PDO, (b) TAG, (c) WPWP. For the model data, color bars show probabilities derived from ensemble-average data and black whiskers show the range of probability derived from ensemble members.
Statistical downscaling techniques developed to transform coarse-scale ESM hindcasts and forecasts of hydro-meteorological variables to the fine-scale required to drive SWAT.
A cross-validated regression technique developed for decadal hydro-meteorological predictions. A regression equation between an observed, dependent variable such as precipitation or Palmer Drought Severity Index (PDSI) at each grid point of a geographical grid, and observed indices of the PDO, the TAG, the WPWP, and the Niño 3.4; using data from 1961 to 2010, with cross-validation based on one decade’s data at a time. The regression equation then used to make prediction of the dependent variable at each grid point using hindcast/forecast DCV indices from ESMs. This technique tried for decadal PDSI prediction in southern Africa and shows increasing skill (correlation coefficient and root-mean-square error between observed and predicted PDSI) from the 1960s to the 2000s (Figure 13; Mehta et al., 2014) Downscaling and hybrid prediction now being used to make fine-scale hydro-meteorological predictions for the MRB, which will be used to drive fine-scale SWAT to make water and crop yields predictions.
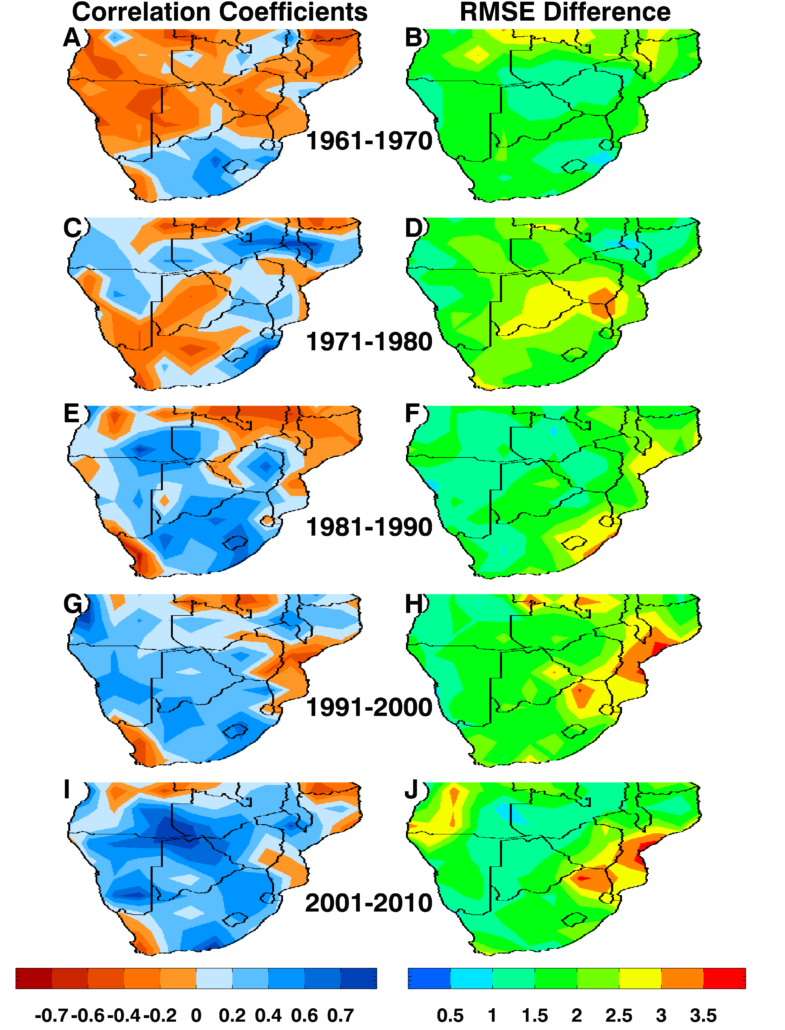 Figure 13: Correlation coefficients and root-mean-square differences between actual and hindcast PDSI from 1961 to 2009–2010, averaged over the October–March rainy season at 2.5º longitude–2.5º latitude grid spacing in Southern Africa. Color scales are shown below the figure. The thresholds for significance of correlation coefficients are +/-0.63 for 95%, +/-0.55 for 90%, +/-0.49 for 85%, +/-0.44 for 80%, and +/-0.40 for 75%.
Value of Decadal Climate Variability Information to the MRB Agriculture
Why is there value in DCV information?
- Decision makers would likely make adjustments for revised expectations of crop yields and water supply.
- If farmers knew water demands would be higher and supplies smaller, they might plant a smaller area.
- If they knew some crop yields would be lower and others higher, they might shift crop mix.
- If water planners knew water would be short, they might encourage conservation, reduce use and negotiate options to buy out some agricultural water rights.
These actions compared to actions based on the historical climatic record would generate value.
Water and agriculture crop choices model RIVERSIM used to estimate value of DCV information.
- Modeling Scope
- 16 crops, 411 counties in the MRB; irrigated and dryland cropping; municipal and industrial water use
- DCV impacts on 5 crops: wheat (spring and winter), corn, sorghum, soybeans; hydrological flow balance; reservoir storage
- Uncertainty about which combination of phases of major DCV phenomena will occur in the next one year
- Includes crop insurance
Estimated value: $80 million per year if perfect information available for next year’s DCV compared to historical frequency; $30 million per year if information available for next year’s DCV phase based on this year’s phase (Fernandez et al., 2016).