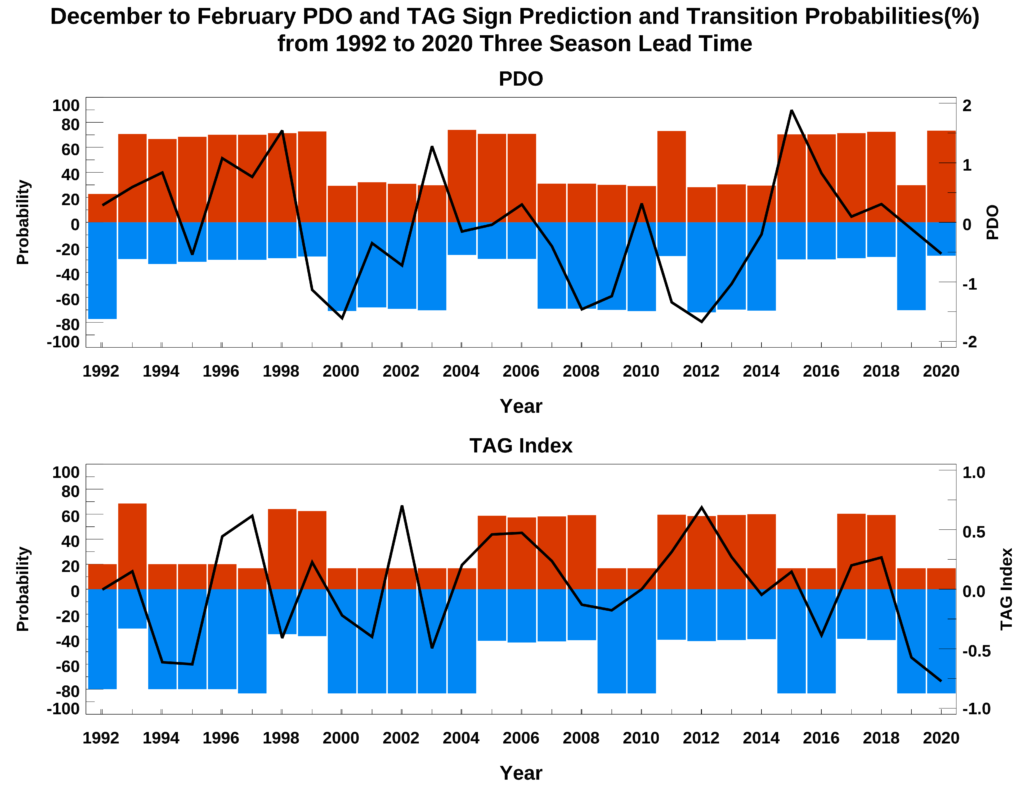
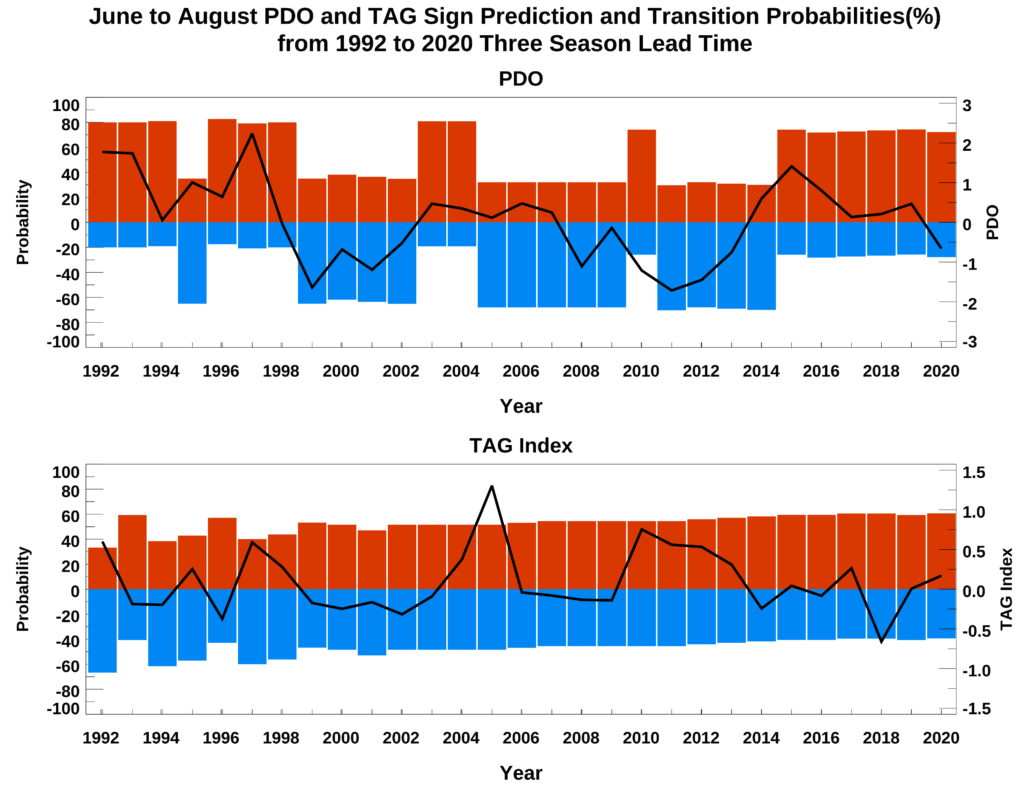
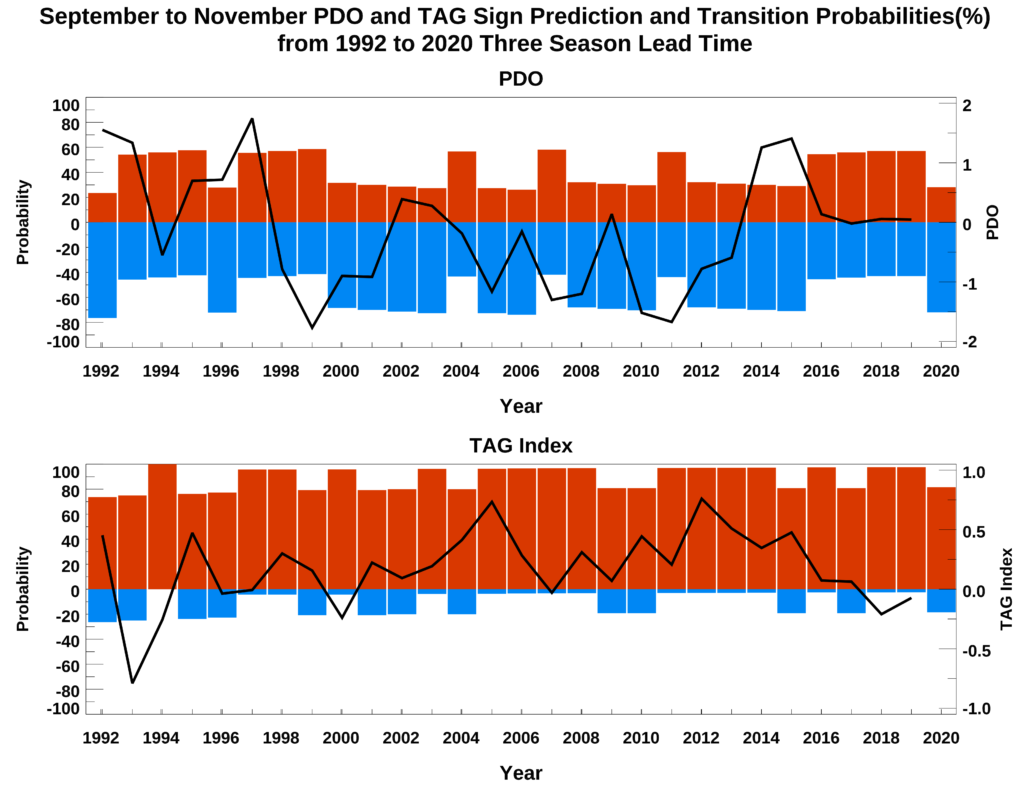
For each season, the PDO and TAG phases were predicted using the transition probabilities between three-season phases from 1951 to the season one year prior to make the prediction. For example to predict June to August 2008, transition probabilities from September to November 1951 to June to August 2007 where used, along with September to November 2007 current DCV phases. Below are the probability time series of the predicted phase for each seasonal DCV (bars) and the observed seasonal DCV (line). The predicted phase with the larger probability was used in the three-season lead time dryness/wetness outlooks.
Choose a three-season lead time timeseries to display:


