Associations between DCV phenomena and river flows are shown here. River flow data from January 1961 through December 2014 from the Global Runoff Data Centre (GRDC) were used. Monthly data were created from daily data where at least 50% of the data were available. Locations were selected where at least 80% of the annual or seasonal data were available. Linear trends were removed from all river flow data prior to analysis.
Annual and seasonal correlations between DCV indices and river flow can be displayed.
Choose a DCV phenomenon to display its correlation coefficient maps with river flows:
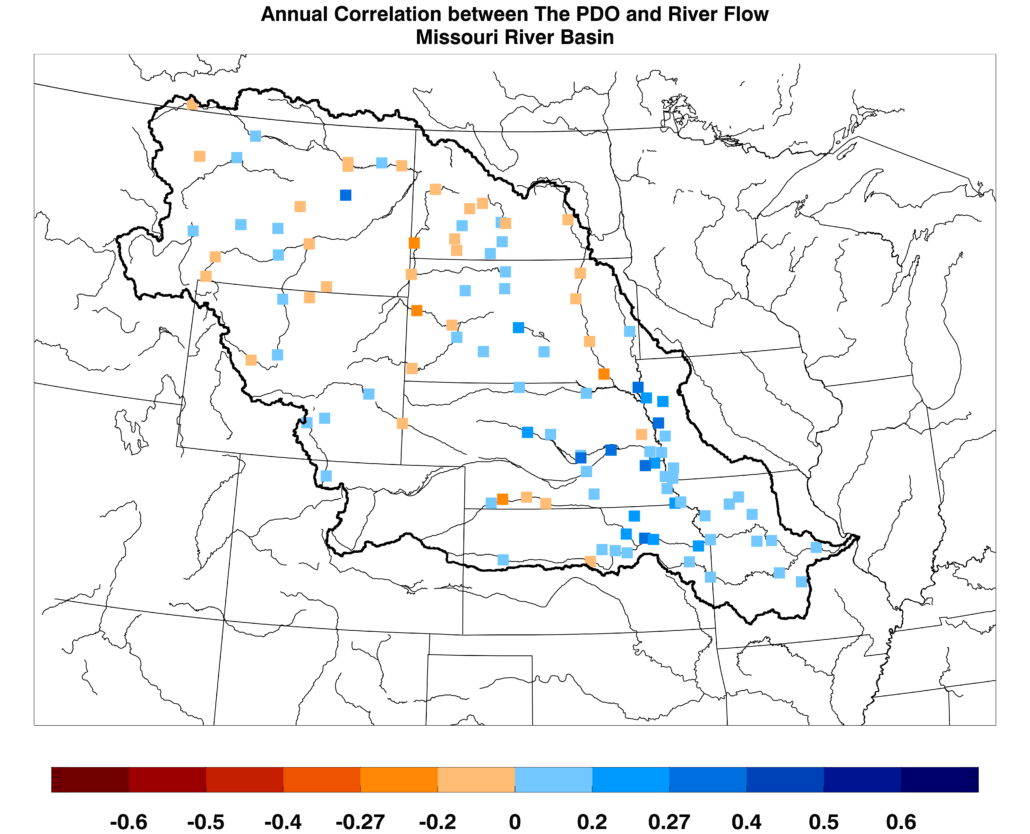
River Flow and PDO Correlations
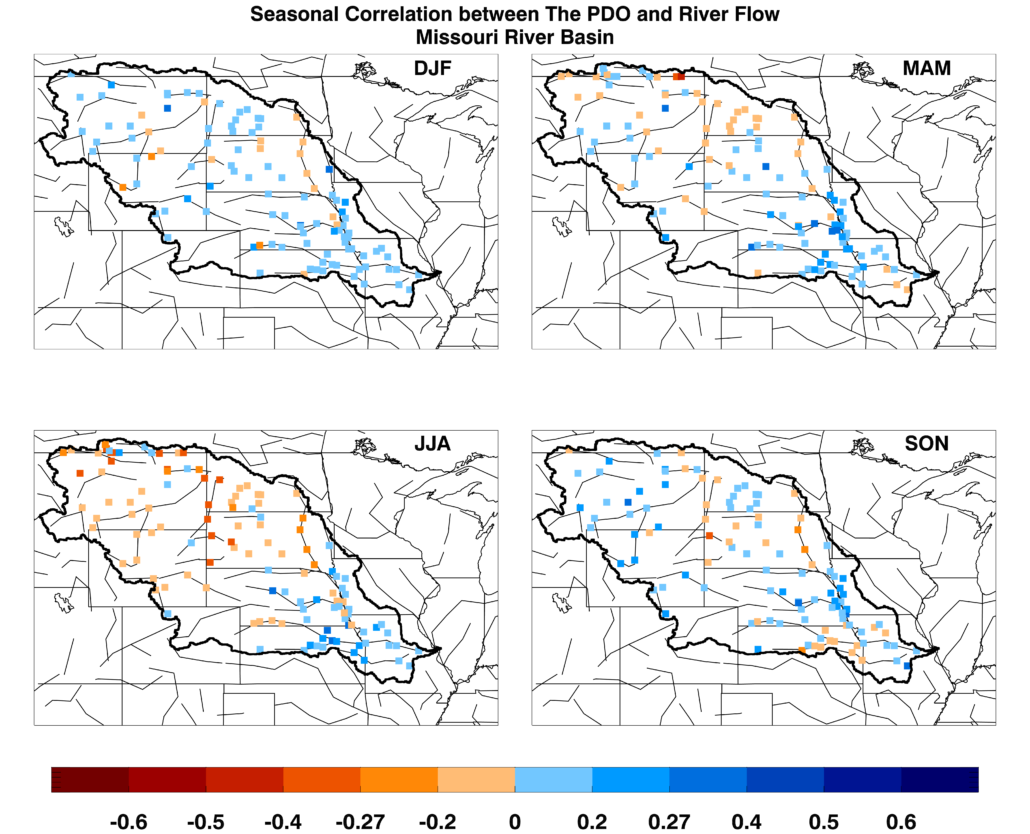
Annual and seasonal correlation maps between the Pacific Decadal Oscillation (PDO) and river flow from 1961 to 2014 are shown for the MRB where at least 80% of data are available. Any correlation above/below +/- 0.27 is significant at the 95% significance threshold using a t-test score.
Positive correlation (blue) result from either positive PDO and above average river flow, or negative PDO and below average river flow. Negative correlation (red) result from either positive PDO and below average river flow, or negative PDO and above average river flow. Seasons are defined as December-January-February (DJF), March-April-May (MAM), June-July-August (JJA), and September-October-November (SON).
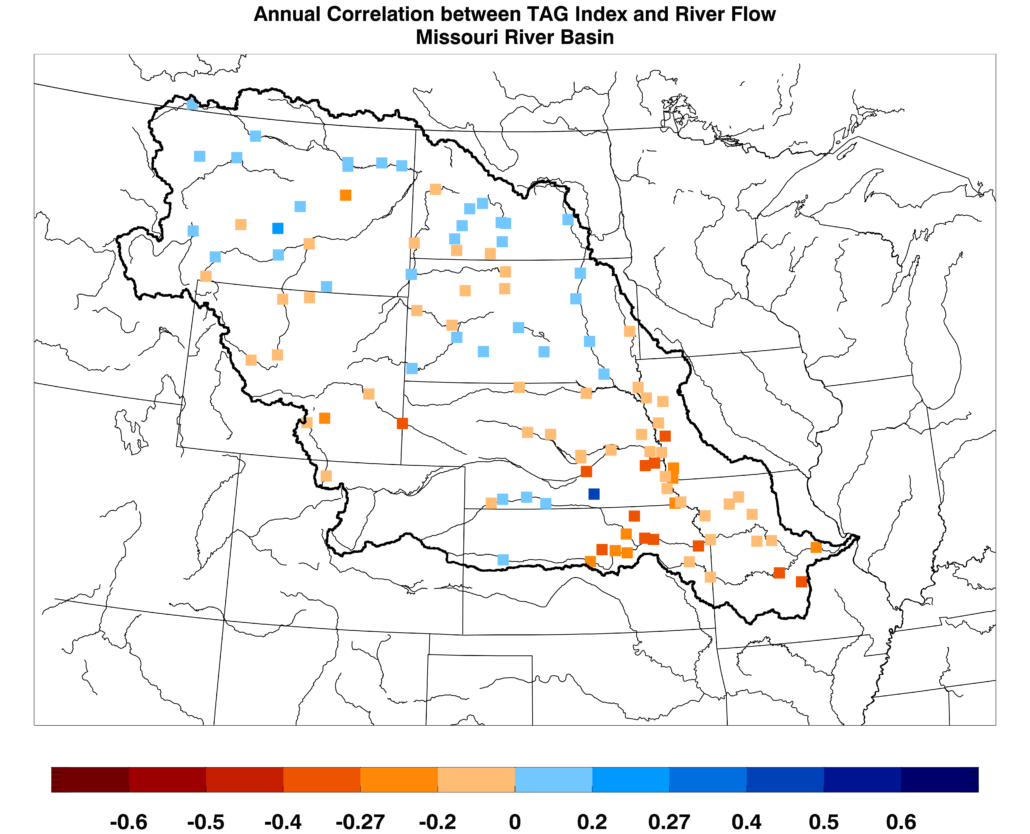
River Flow and TAG Correlations
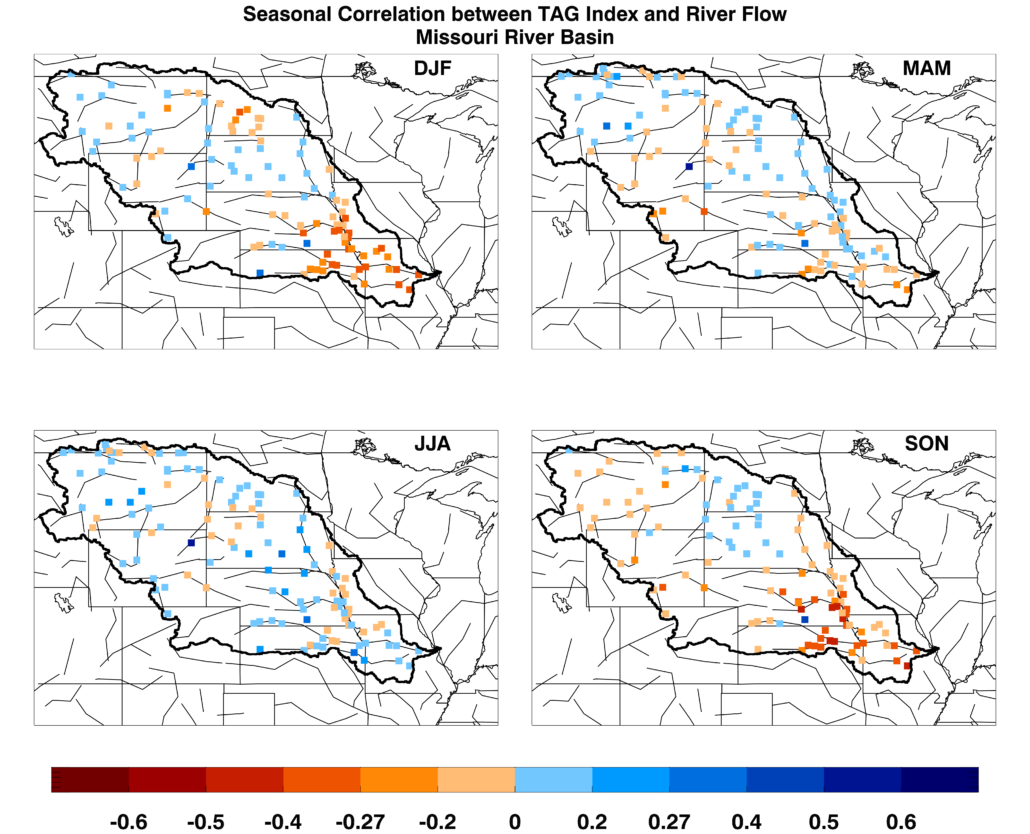
Annual and seasonal correlation maps between the Tropical Atlantic SST gradient (TAG) variability and river flow from 1961 to 2014 are shown for the MRB where at least 80% of data are available. Any correlation above/below +/- 0.27 is significant at the 95% significance threshold using a t-test score.
Positive correlation (blue) result from either positive TAG and above average river flow, or negative TAG and below average river flow. Negative correlation (red) result from either positive TAG and below average river flow, or negative TAG and above average river flow. Seasons are defined as December-January-February (DJF), March-April-May (MAM), June-July-August (JJA), and September-October-November (SON).
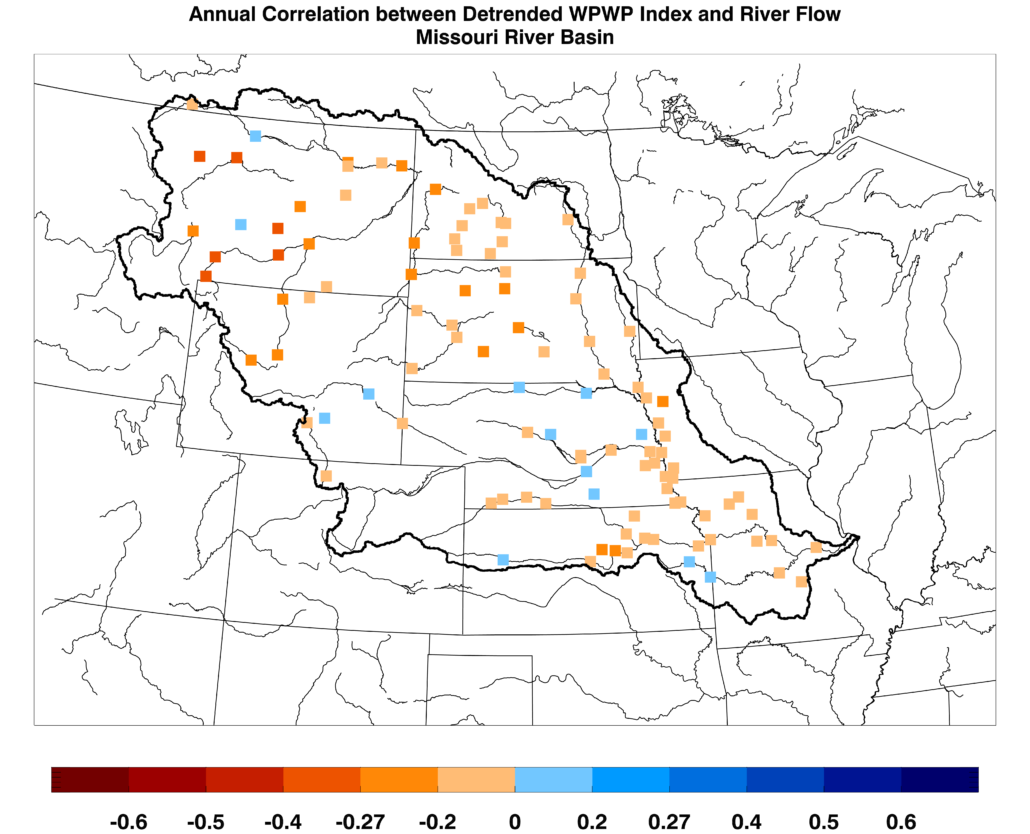
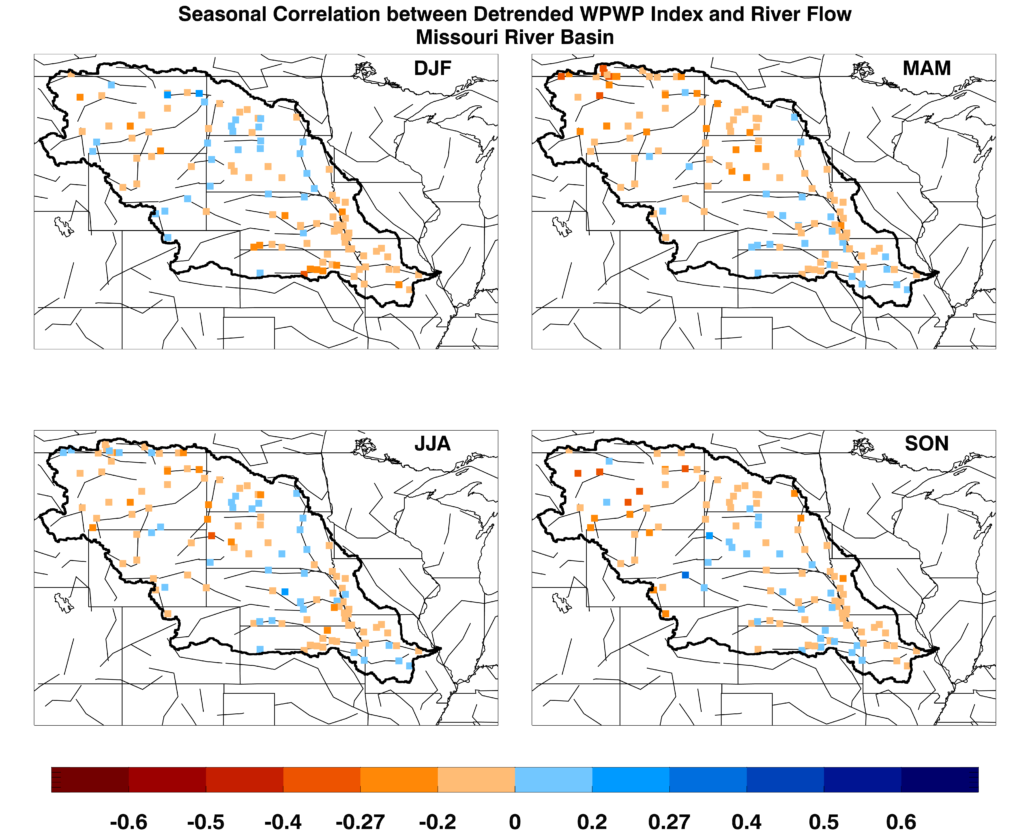
River Flow and WPWP Correlations
Annual and seasonal correlation maps between the detrended West Pacific Warm Pool (WPWP) index and river flow from 1961 to 2014 are shown for the MRB where at least 80% of data are available. WPWP index was detrended before calculating correlation coefficients because it has a pronounced linear trend. Any correlation above/below +/- 0.27 is significant at the 95% significance threshold using a t-test score.
Positive correlation (blue) result from either positive WPWP and above average river flow, or negative WPWP and below average river flow. Negative correlation (red) result from either positive WPWP and below average river flow, or negative WPWP and above average river flow. Seasons are defined as December-January-February (DJF), March-April-May (MAM), June-July-August (JJA), and September-October-November (SON).
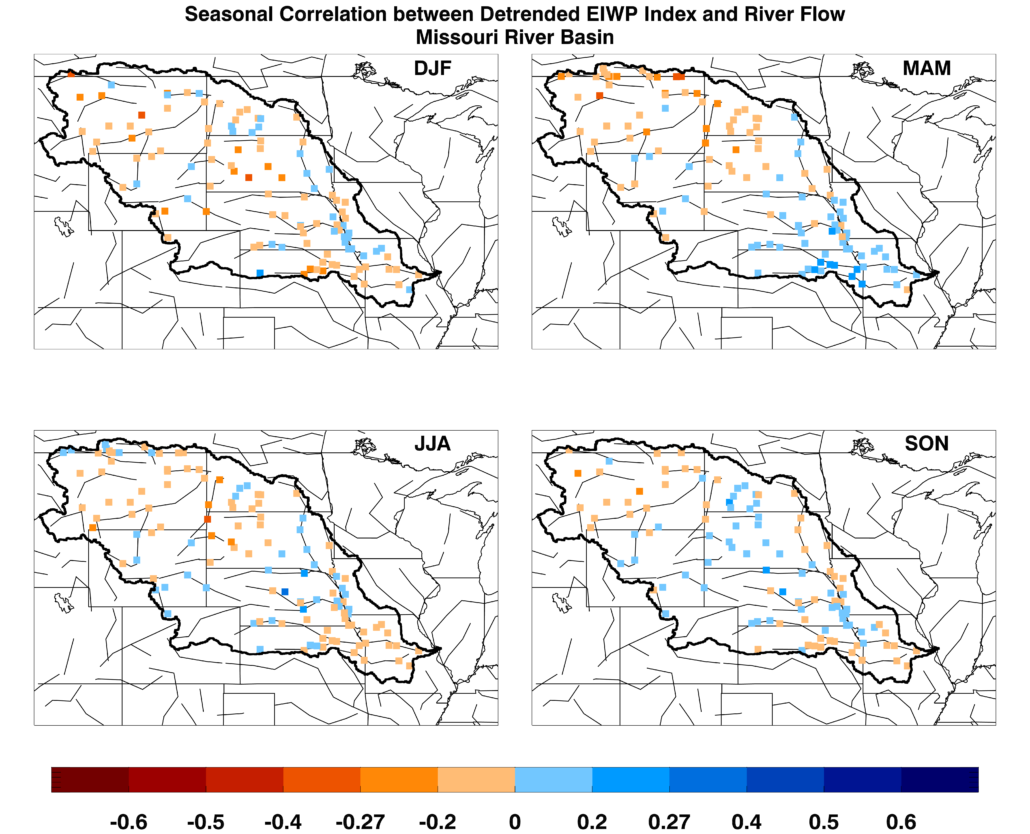
River Flow and EIWP Correlations
Annual and seasonal correlation maps between the detrended East Indian Warm Pool (EIWP) index and river flow from 1961 to 2014 are shown for the MRB where at least 80% of data are available. EIWP index was detrended before calculating correlation coefficients because it has a pronounced linear trend. Any correlation above/below +/- 0.27 is significant at the 95% significance threshold using a t-test score.
Positive correlation (blue) result from either positive EIWP and above average river flow, or negative EIWP and below average river flow. Negative correlation (red) result from either positive EIWP and below average river flow, or negative EIWP and above average river flow. Seasons are defined as December-January-February (DJF), March-April-May (MAM), June-July-August (JJA), and September-October-November (SON).

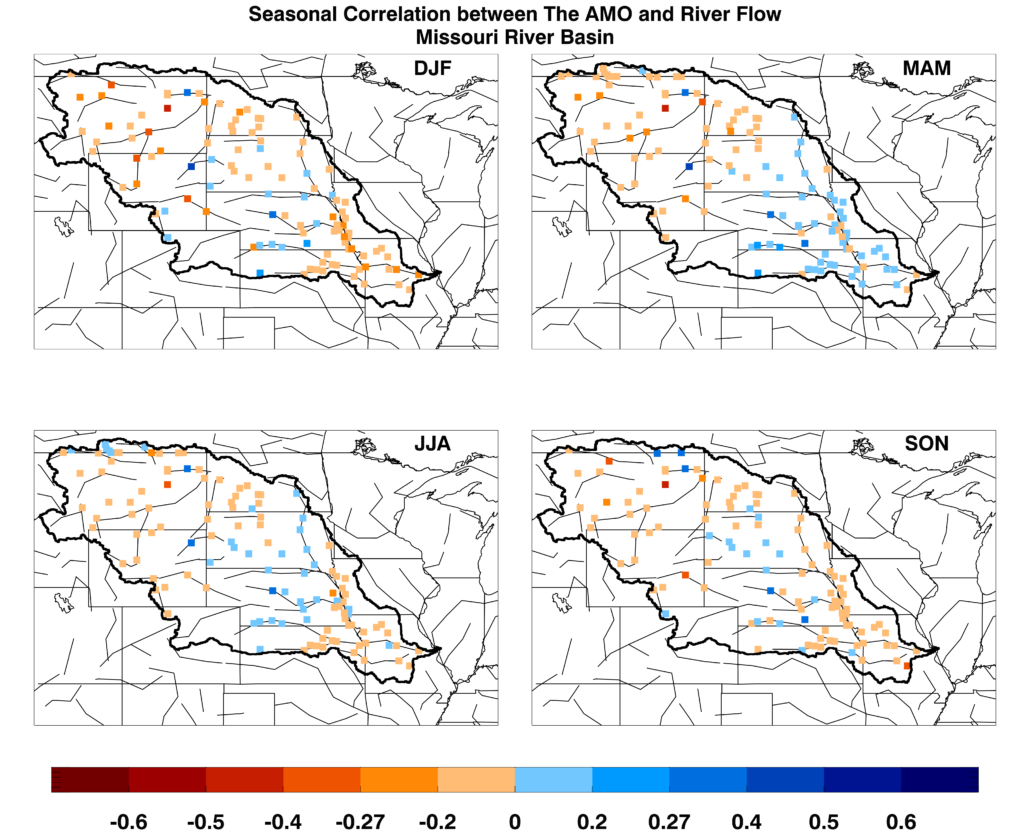
River Flow and AMO Correlations
Annual and seasonal correlation maps between the Atlantic Multidecadal Oscillation (AMO) and river flow from 1961 to 2014 are shown for the MRB where at least 80% of data are available. Any correlation above/below +/- 0.27 is significant at the 95% significance threshold using a t-test score.
Positive correlation (blue) result from either positive AMO and above average river flow, or negative AMO and below average river flow. Negative correlation (red) result from either positive AMO and below average river flow, or negative AMO and above average river flow. Seasons are defined as December-January-February (DJF), March-April-May (MAM), June-July-August (JJA), and September-October-November (SON).

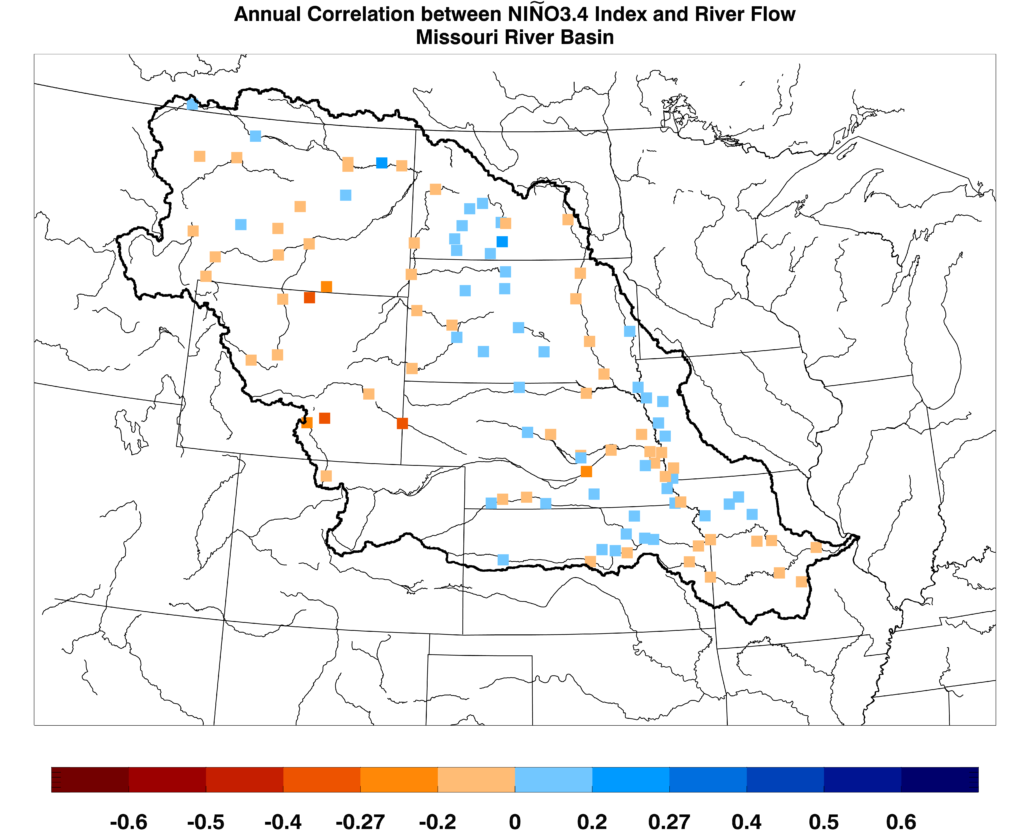
River Flow and Niño3.4 Correlations
Annual and seasonal correlation maps between the Niño3.4 index and river flow from 1961 to 2014 are shown for the MRB where at least 80% of data are available. Any correlation above/below +/- 0.27 is significant at the 95% significance threshold using a t-test score.
Positive correlation (blue) result from either positive Niño3.4 and above average river flow, or negative Niño3.4 and below average river flow. Negative correlation (red) result from either positive Niño3.4 and below average river flow, or negative Niño3.4 and above average river flow. Seasons are defined as December-January-February (DJF), March-April-May (MAM), June-July-August (JJA), and September-October-November (SON).

Major conclusions of these and other analyses are:
- Very large – 20-30% of annual-average or even larger – multiyear river flow anomalies are associated with DCV phenomena.
- There is physical consistency among implied precipitation, dryness/wetness, and river flows in the MRB; and DCV phenomena.